In this tutorial, we will use an example to show python opencv beginners on how to draw grayscale image histogram using cv2.calcHist().

1.Open an grayscale image using opencv
import cv2
import numpy as np
from matplotlib import pyplot as plt

gray_img = cv2.imread('images/GoldenGateSunset.png', cv2.IMREAD_GRAYSCALE)
cv2.imshow('GoldenGate',gray_img)
2.Calculate histogram value using cv2.calcHist()
hist = cv2.calcHist([gray_img],[0],None,[256],[0,256])
We should notice:
cv2.calcHist() is defined as:
cv2.calcHist(images, channels, mask, histSize, ranges[, hist[, accumulate]])
Parameters are:
- images: source image
- channels: the index of channel for which we calculate histogram. For example, if input is grayscale image, its value is [0]. For color image, you can pass [0],[1] or [2] to calculate histogram of blue,green or red channel, respectively.
- mask: mask image.
- histSize: this represents our BIN count.For full scale, we pass [256].
- ranges: Normally, it is [0,256].
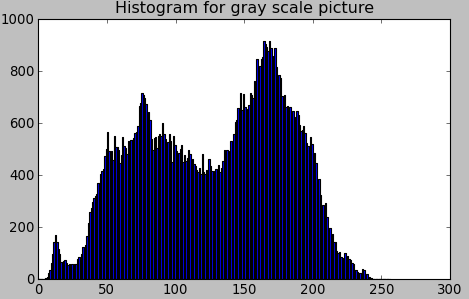
3.Display histogram plot using matplotlib
plt.hist(gray_img.ravel(),256,[0,256])
plt.title('Histogram for gray scale picture')
plt.show()
4.Release resources
while True:
    k = cv2.waitKey(0) & 0xFF
    if k == 27: break             # ESC key to exit
cv2.destroyAllWindows()
Run this code, you may get this histogram: