In this tutorial, we will introduce how to draw color image red, green and blue histogram using cv2.calcHist() for python opencv beginners.

1.Open a color image
import cv2
import numpy as np
from matplotlib import pyplot as plt

img = cv2.imread('images/GoldenGateSunset.png', -1)
cv2.imshow('GoldenGate',img)
2.Draw red, green and blue channel histogram respectively
color = ('b','g','r')
for channel,col in enumerate(color):
    histr = cv2.calcHist([img],[channel],None,[256],[0,256])
    plt.plot(histr,color = col)
    plt.xlim([0,256])
To understand how to use cv2.calcHist(), you can read this tutorial:
Python OpenCV: Draw Grayscale Image Histogram Using cv2.calcHist()
3.Show color image histogram
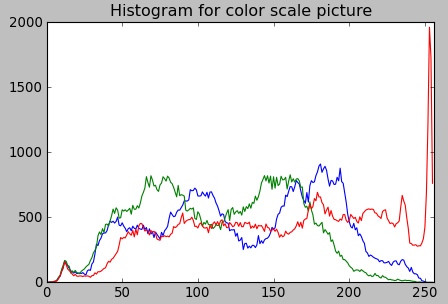
plt.title('Histogram for color scale picture')
plt.show()

while True:
    k = cv2.waitKey(0) & 0xFF
    if k == 27: break             # ESC key to exit
cv2.destroyAllWindows()
Run this code, you will see this color image histogram: