It is easy to create a custom line plot in python matplotlib. In this tutorial, we will use some examples to show you how to do.

1.Import library
import matplotlib.pyplot as plt
import numpy as np
2.Prepare data for line plot
x = np.random.randint(low=1, high=10, size=25)
3.Display line plot in matplotlib
plt.plot(x, color = 'blue', linewidth=3, linestyle='-.')
plt.show()
Run this code, you will see this line plot:

However, we can set other parameters to create a custom line plot in plt.plot().
Here is another example:
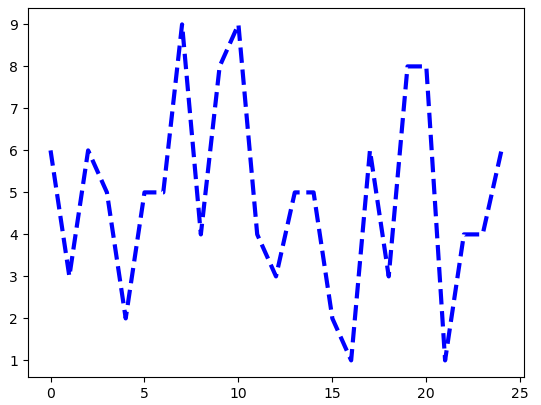
plt.plot(x, color = 'blue', linewidth=3, linestyle='dashed')
plt.show()
Here linestyle=’dashed’, run this code, you will see: