In this tutorial, we will use an example to show you how to create a stack plot using plt.stackplot() in matplotlib.

1.Import library
import matplotlib.pyplot as plt
import numpy as np
2.Prepare data for stack plot
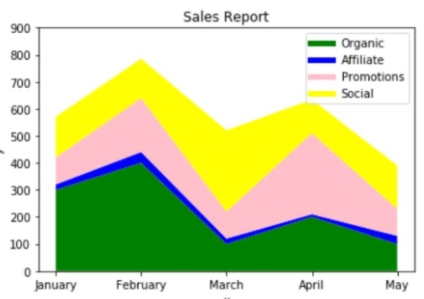
months = ['January', 'February', 'March', 'April', 'May']
Organic = [300,400,100,200,100]
Affiliate = [20,40,20,10,30]
Promotions = [100,200,100,300,100]
Social = [150,145,300,124,160]
3.Create stack plot
plt.plot([],[],color='green', label='Organic', linewidth=5)
plt.plot([],[],color='blue', label='Affiliate', linewidth=5)
plt.plot([],[],color='pink', label='Promotions', linewidth=5)
plt.plot([],[],color='yellow', label='Social', linewidth=5)

plt.stackplot(months, Organic, Affiliate,Promotions, Social, colors=['green','blue','pink','yellow'])
4.Set x, y labels
plt.xlabel('x')
plt.ylabel('y')
5.Se y axis range
plt.yticks(np.arange(0, 1000, step=100))
6.Display stack plot in matplotlib
plt.title('Sales Report')

plt.legend()
plt.show()
Run this code, you will see this stack plot: