In this tutorial, we will use an example to show you how to draw multiple plots in the same figure using plt.subplots() in matplotlib.

1.Import library
import matplotlib.pyplot as plt
2.Prepare data
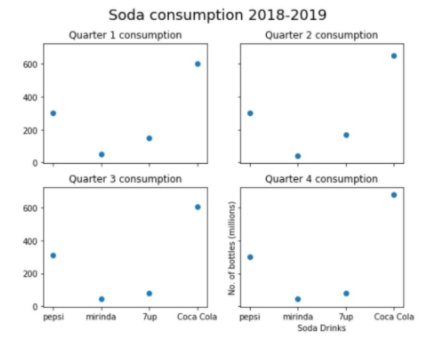
drinks = ['pepsi', 'mirinda', '7up', 'Coca Cola']
q1 = [300, 50, 150, 600]
q2 = [302, 43, 167, 650]
q3 = [310, 47, 78, 609]
q4 = [303, 45, 80, 680]
3.Create multiple plots using plt.subplots()
fig, axes = plt.subplots(2, 2, figsize=(8, 6), sharex=True, sharey=True)
In this example code, we will create 2*2 = 4 plots in the same figure.
4.Set figure title
fig.suptitle('Soda consumption 2018-2019', fontsize=18)
5.Draw each plot in the same figure
# Top Left Subplot
plt.xlabel("Soda Drinks")
plt.ylabel("No. of bottles (millions)")
axes[0,0].scatter(drinks, q1)
axes[0,0].set_title("Quarter 1 consumption")

# Top Right Subplot
axes[0,1].scatter(drinks, q2)
axes[0,1].set_title("Quarter 2 consumption")

# Bottom Left Subplot
axes[1,0].scatter(drinks, q3)
axes[1,0].set_title("Quarter 3 consumption")

# Bottom Right Subplot
axes[1,1].scatter(drinks, q4)
axes[1,1].set_title("Quarter 4 consumption")
We will use axes to operate each plot in the same figure.
6.Show plots
plt.show()
Run this code, you will seet: