In matplotlib, we can use plt.scatter() to create a scatter plot. Here is the tutorial:
Matplotlib: Create a Plot Using plt.scatter()
However, we also can change the marker size in the scatter plot. In this tutorial, we will introduce how to do.
Look at this example code:
import matplotlib.pyplot as plt
import pandas as pd
df = pd.read_csv('worldHappiness2019.csv')
size = df['Score'].to_numpy()
s = [3*s**2 for s in size]
fig, ax = plt.subplots(figsize=(10, 6))
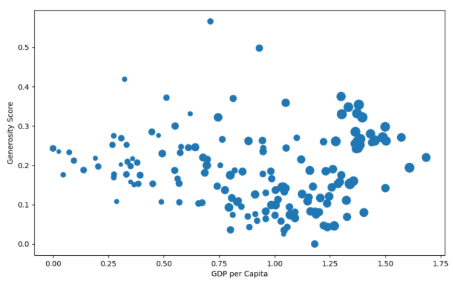
ax.scatter(x = df['GDP per capita'], y = df['Generosity'], s = s)
plt.xlabel("GDP per Capita")
plt.ylabel("Generosity Score")
plt.show()
As to code:
ax.scatter(x = df['GDP per capita'], y = df['Generosity'], s = s)
Here parameter s is the size of marker.
Run this code, you may see this scatter plot: