In this tutorial, we will use an example to show you how to creat a histogram using plt.hist() in matplotlib.

1.Import library
import numpy as np
import matplotlib.pyplot as plt
2.Prepare data for histogram
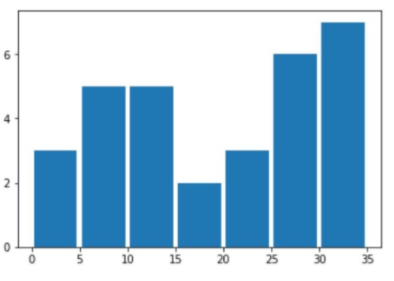
sold = [2,2,3, 5,6,7,8,9,10,10,10,10,10,15,15,20,20,20,25,25,25,25,25,25,30,30,30,30,30,30,30]
price_range = [0,5,10,15,20,25,30,35]

y_range = [0,2,4,6]
3.Create histogram using plt.hist()
plt.yticks(y_range)

plt.hist(sold, bins = price_range, rwidth=0.9)
4.Display histogram
plt.show()
Run this code, you may see this histogram: