In this tutorial, we will use an example to show you how to change plot axes background using ax.set_facecolor() in matplotlib.

1.Prepare data to create a plot in matplotlib
import matplotlib.pyplot as plt
import pandas as pd
weather_data = pd.read_csv("seattleWeather.csv")

PRCP = weather_data['PRCP']
TMAX = weather_data['TMAX']
TMIN = weather_data['TMIN']
The data can be found in tutorial:
Matplotlib: Create a Plot Using plt.scatter()
2.Create axes to change background color
ax = plt.axes()
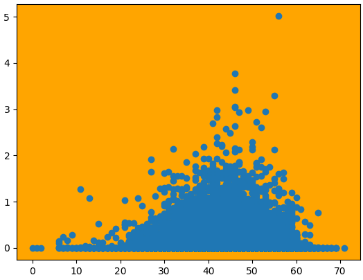
ax.set_facecolor("orange")
# OR
ax.set(facecolor = "orange")
In this code, we will change the background color to orange.
3.Show plot in matplotlib
plt.scatter(TMIN, PRCP)
plt.show()
Run this code, you will see: